
The Lowcountry housing market entered late summer with an interesting combination of signals: fewer homes available for sale, stronger contract activity, longer marketing times, and considerable variation in pricing.
Across the Hilton Head Area REALTORS® market, August pending sales increased 13.8% from a year ago, while closed sales declined 5.5%. Inventory was 3.7% lower than August 2025, and the number of new listings entering the market declined 6.7%. At the same time, homes averaged 134 days on market, up 8.9% from a year earlier.
Taken together, the numbers do not point neatly toward either accelerating or weakening conditions. Instead, they reflect a market where buyer demand remains present, but transactions are taking longer and activity varies considerably by price point, property type, and location.
Contract Activity is One of August's Stronger Signals
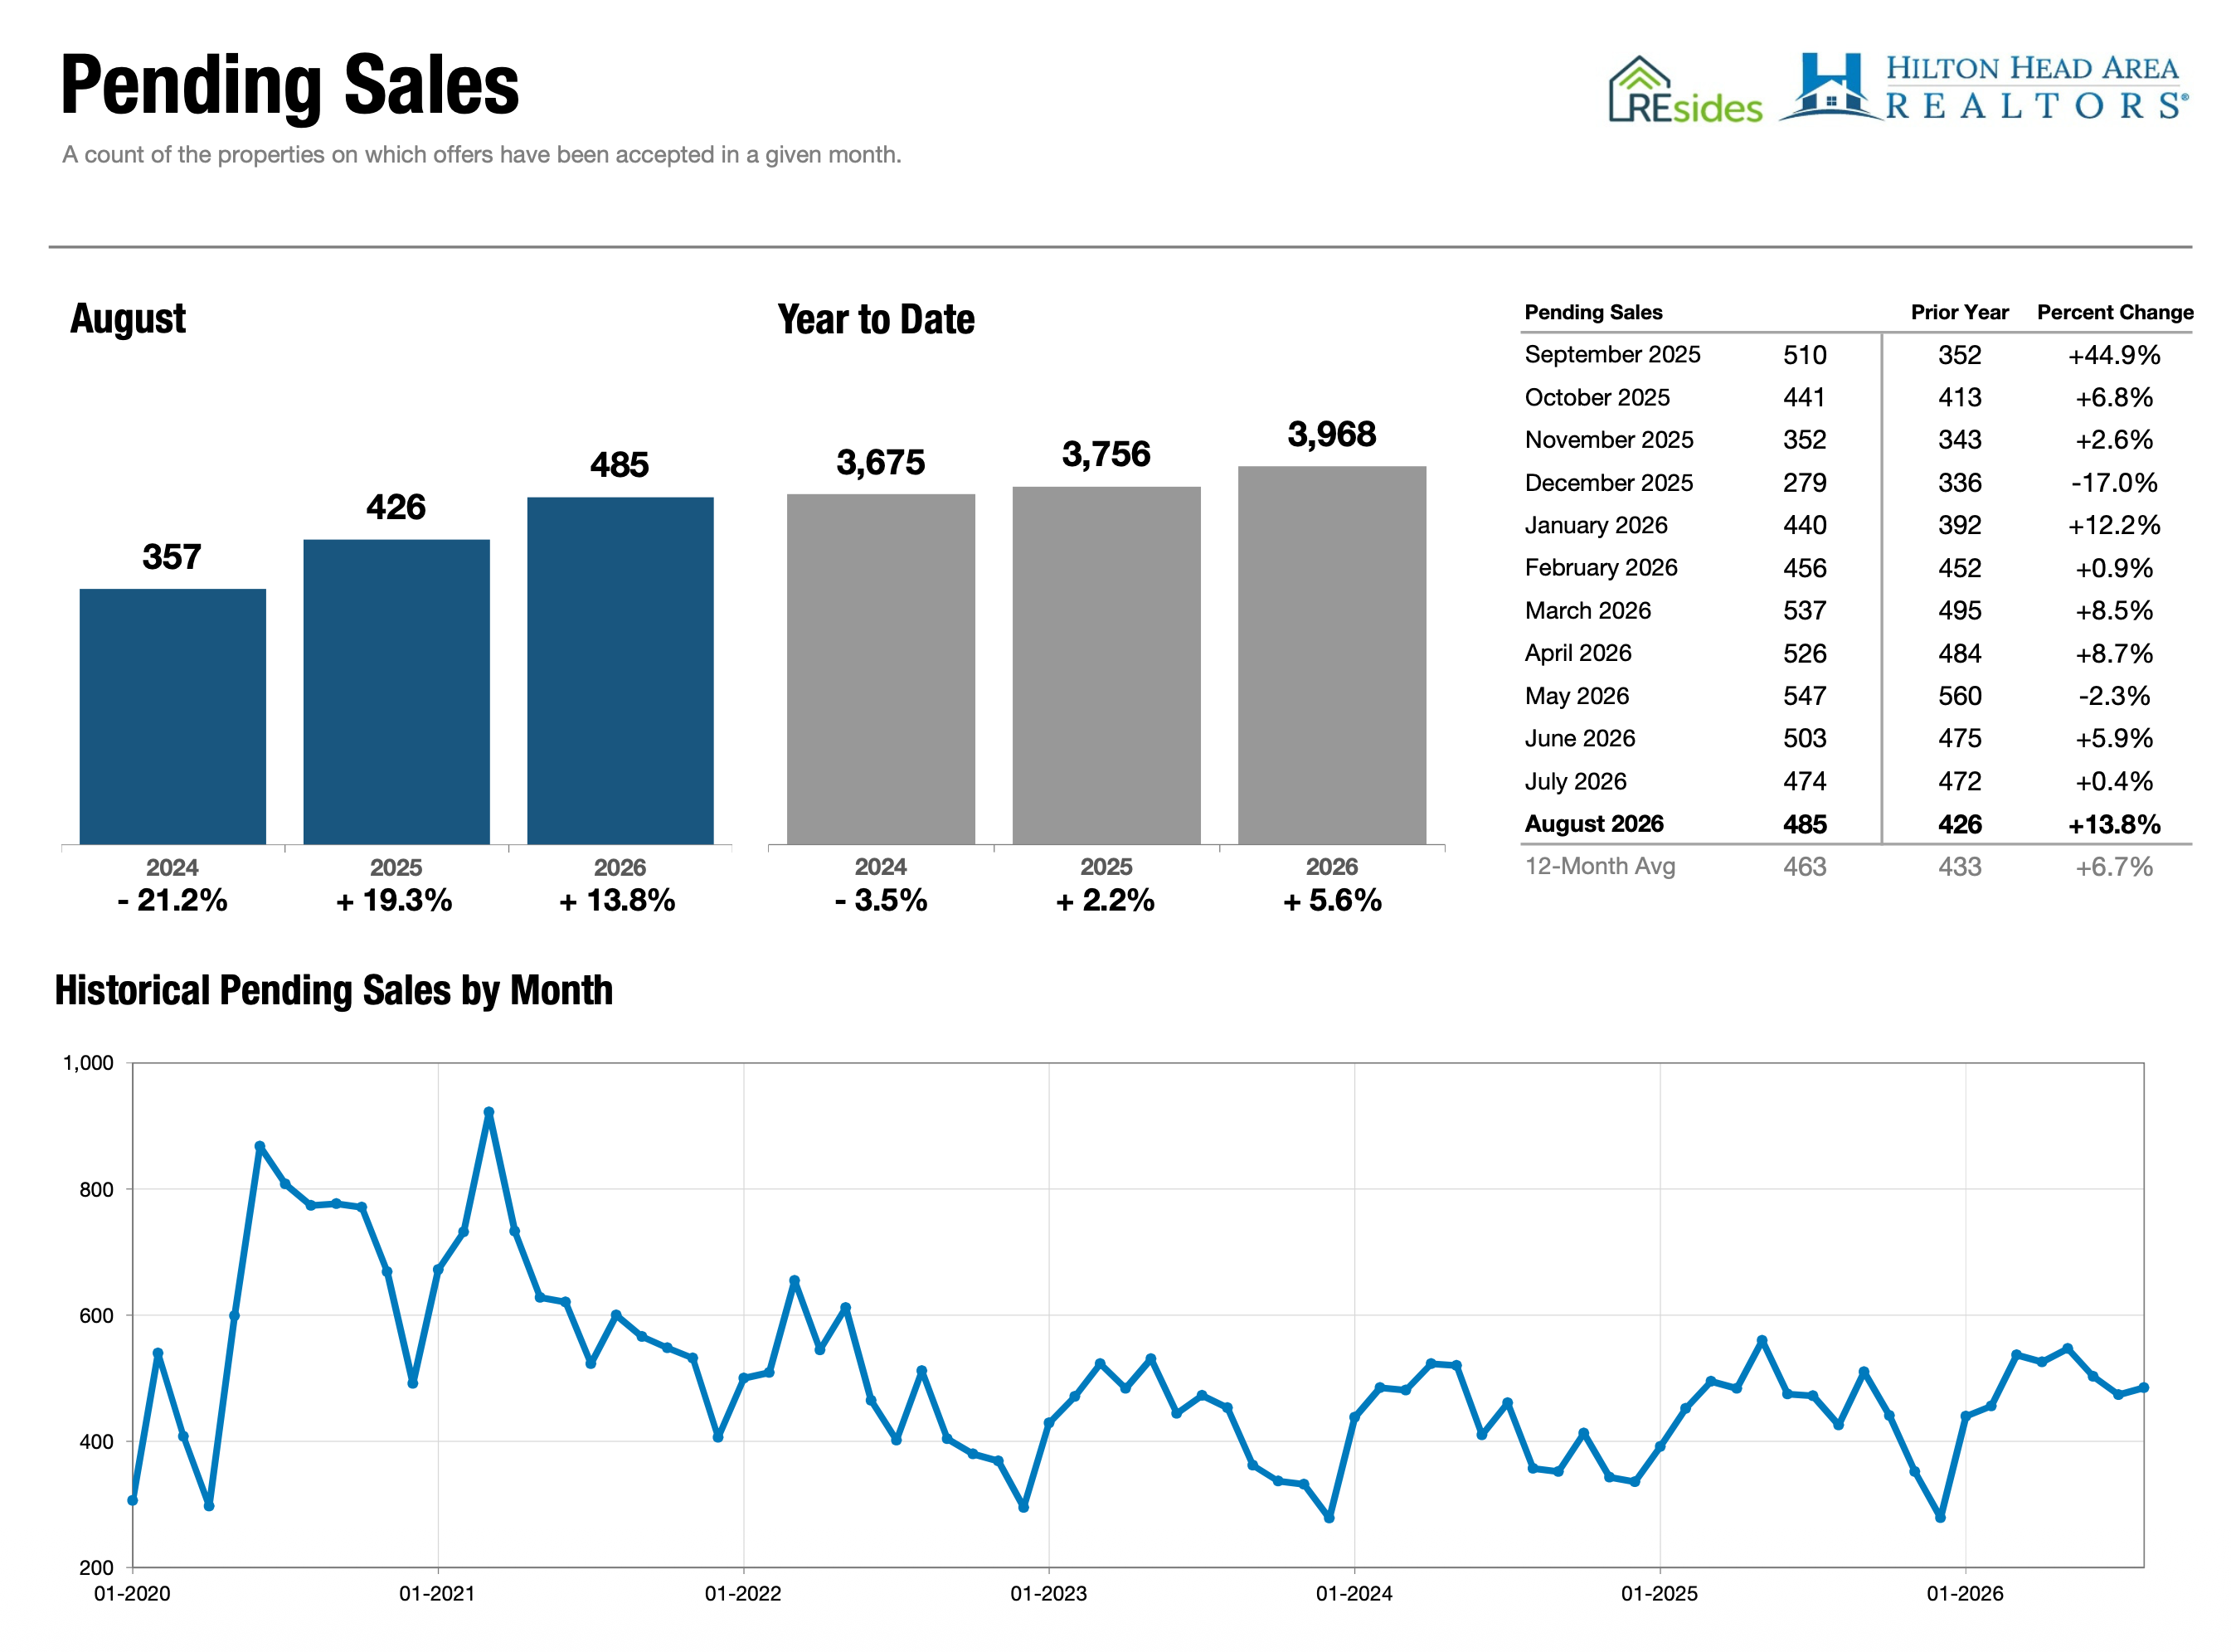
August pending sales provide one of the clearest indications that buyers remain engaged in the Lowcountry market.
A total of 485 properties went under contract during the month, up 13.8% from August 2025. Through the first eight months of 2026, pending sales are 5.6% ahead of the same period last year. Looking across the most recent 12 months provides a similar picture, with pending activity up 6.7% overall.
Closed sales have not moved at the same pace. August recorded 466 closings, down 5.5% from 493 a year earlier. However, year to date closed sales remain essentially level with 2025, increasing 0.2%, while the rolling 12 month total is 2.9% higher.
That distinction is important. A softer month for closings is part of the August picture and should not be overlooked, but the increase in pending activity suggests demand has not simply retreated. Because pending transactions typically precede closings, the relationship between stronger contract activity and future completed sales will be an important trend to watch heading into fall.
Pending Sales, REsides
Fewer Homes Are Entering and Remaining on the Market
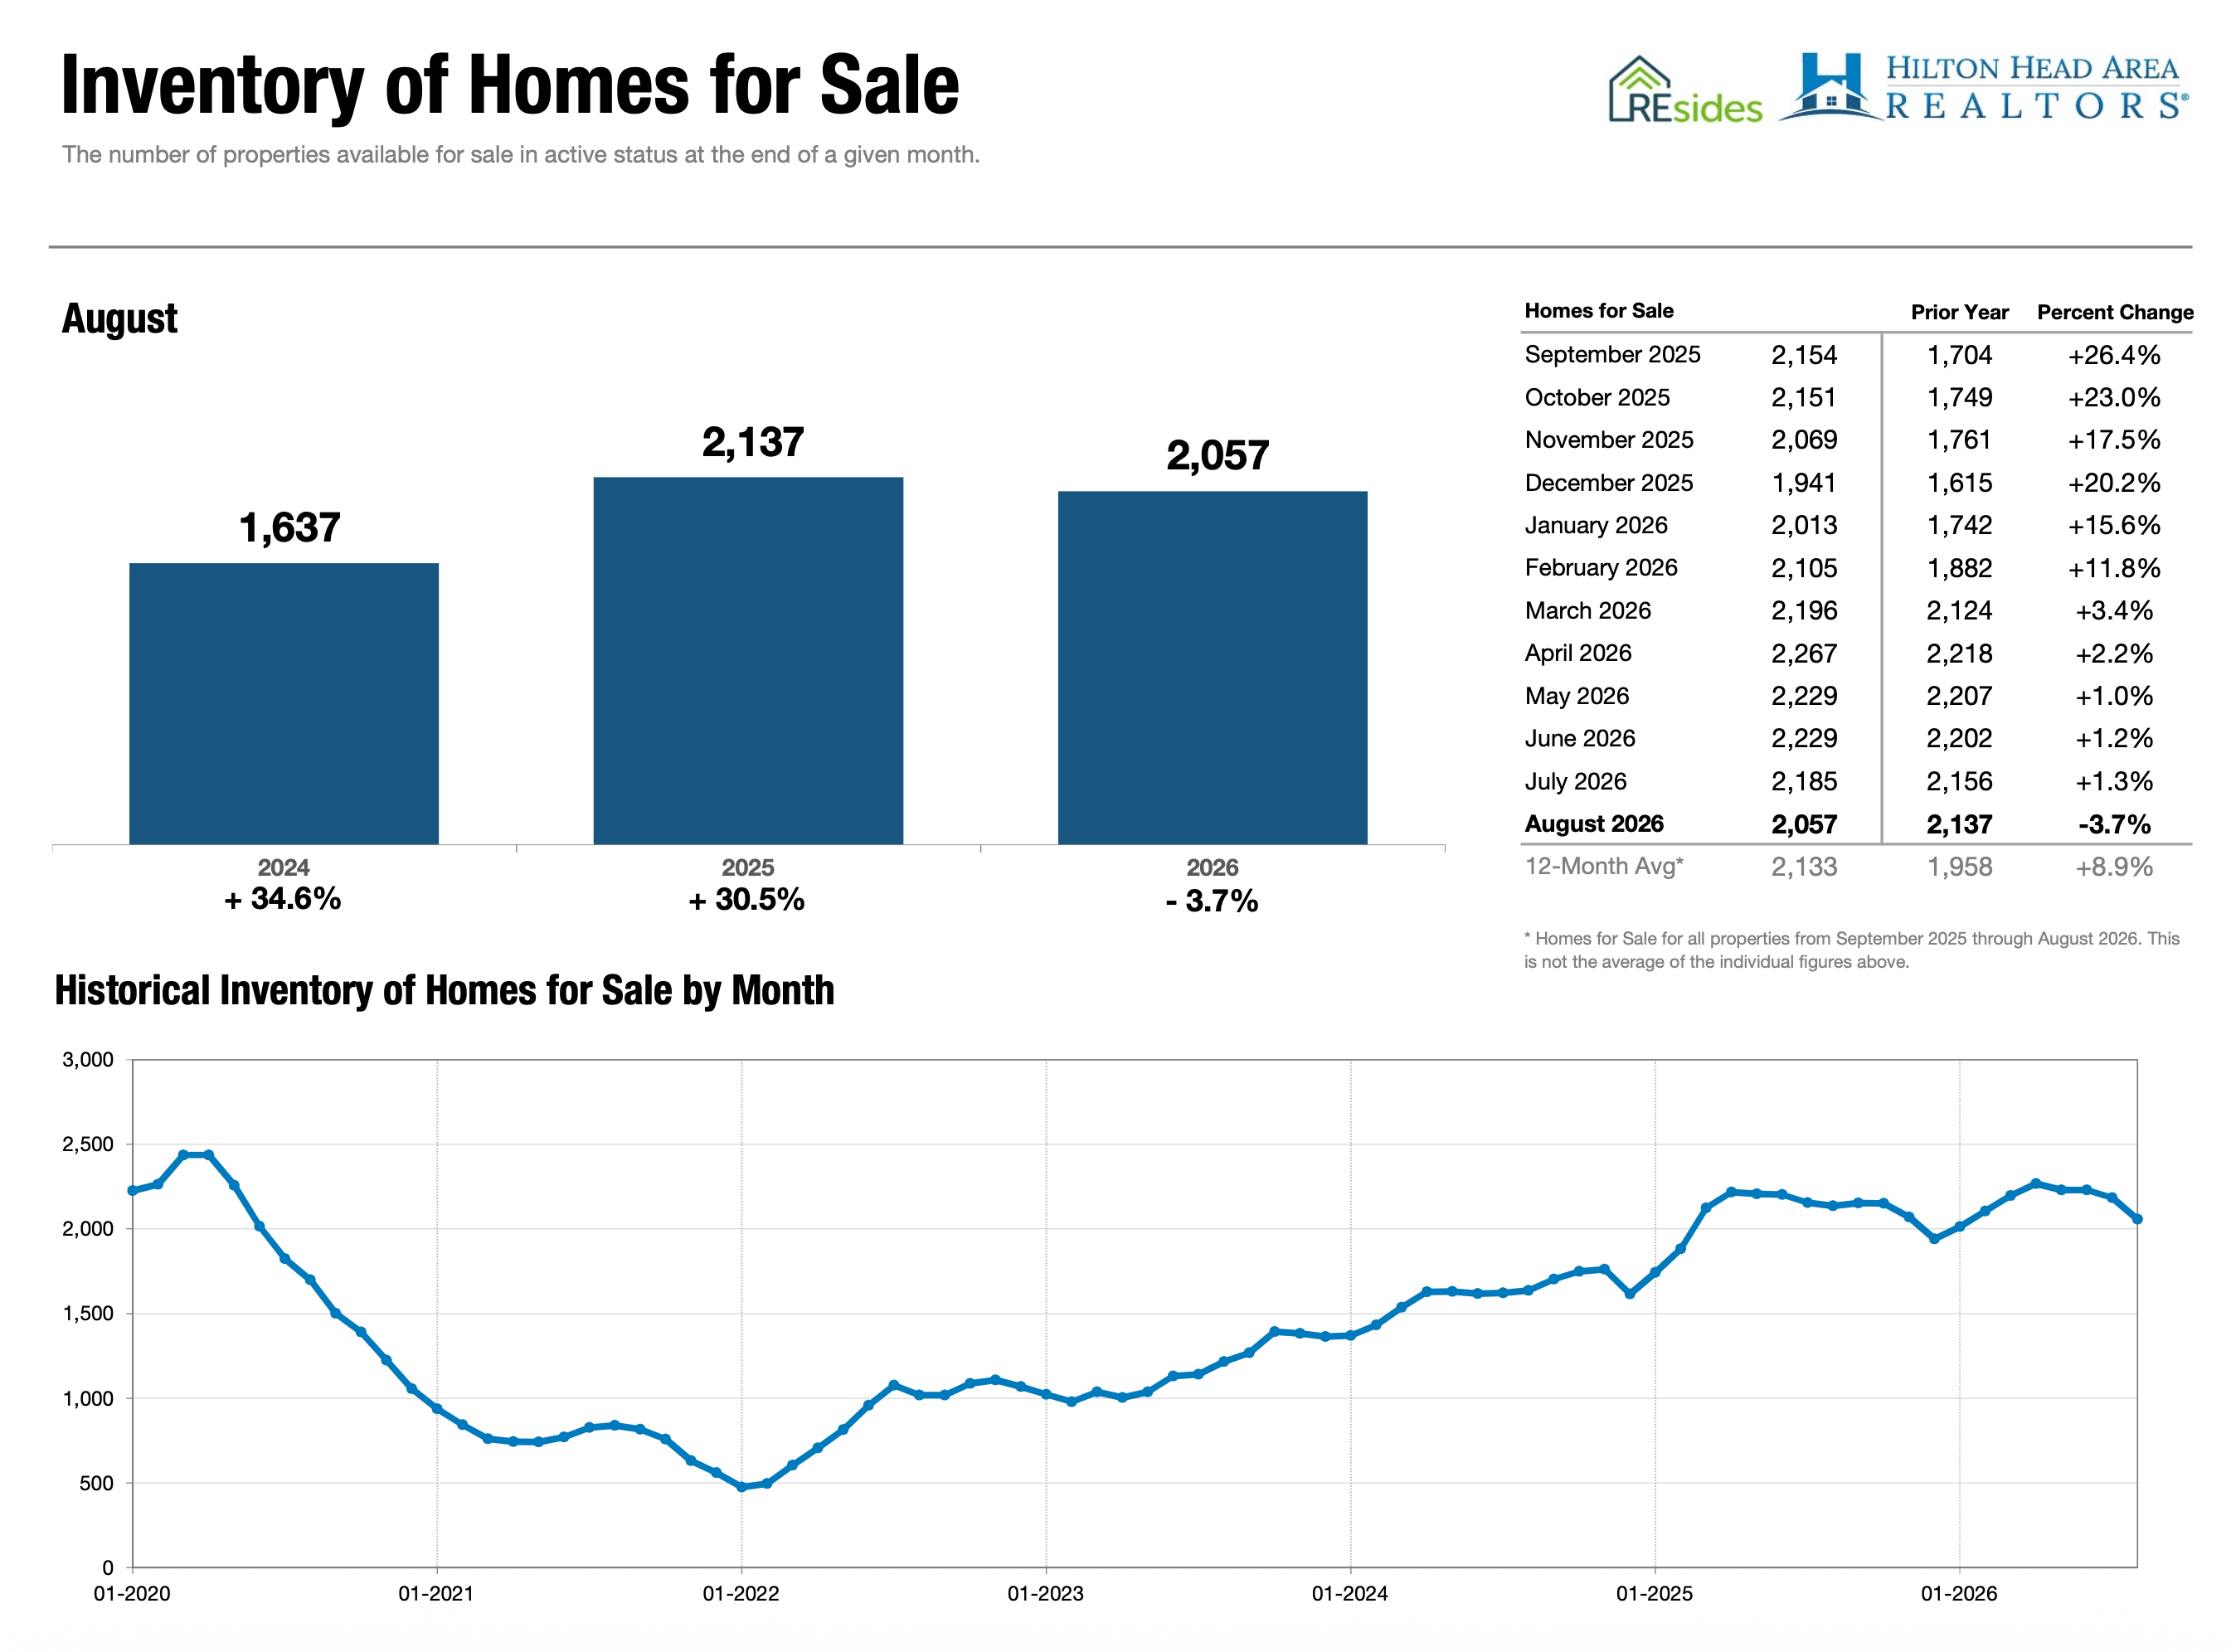
Unlike many markets where inventory has continued to build, Lowcountry supply was lower in August than it was a year ago.
The broader market ended the month with 2,057 homes for sale, down 3.7% from 2,137 in August 2025. New listings also declined 6.7% year over year to 530, while year to date new listings are down 1.7%.
Months supply fell from 4.9 months a year ago to 4.4 months in August, a 10.2% decline. The balance differs by property type, however. Single family homes carried 3.9 months of inventory, compared with 5.9 months for condos.
This creates a different dynamic from a market where rising inventory is consistently increasing competition among sellers. Buyers still have more time to make decisions than they did during the fastest periods of the market, but the number of available properties is not expanding across the Lowcountry as a whole.
For sellers, lower inventory can limit direct competition, but it does not eliminate the need for careful positioning. Longer marketing times make clear that buyers are still exercising considerable selectivity.
Inventory of Homes for Sale, REsides - Aug 2026
Longer Marketing Times Remain an Important Part of the Story
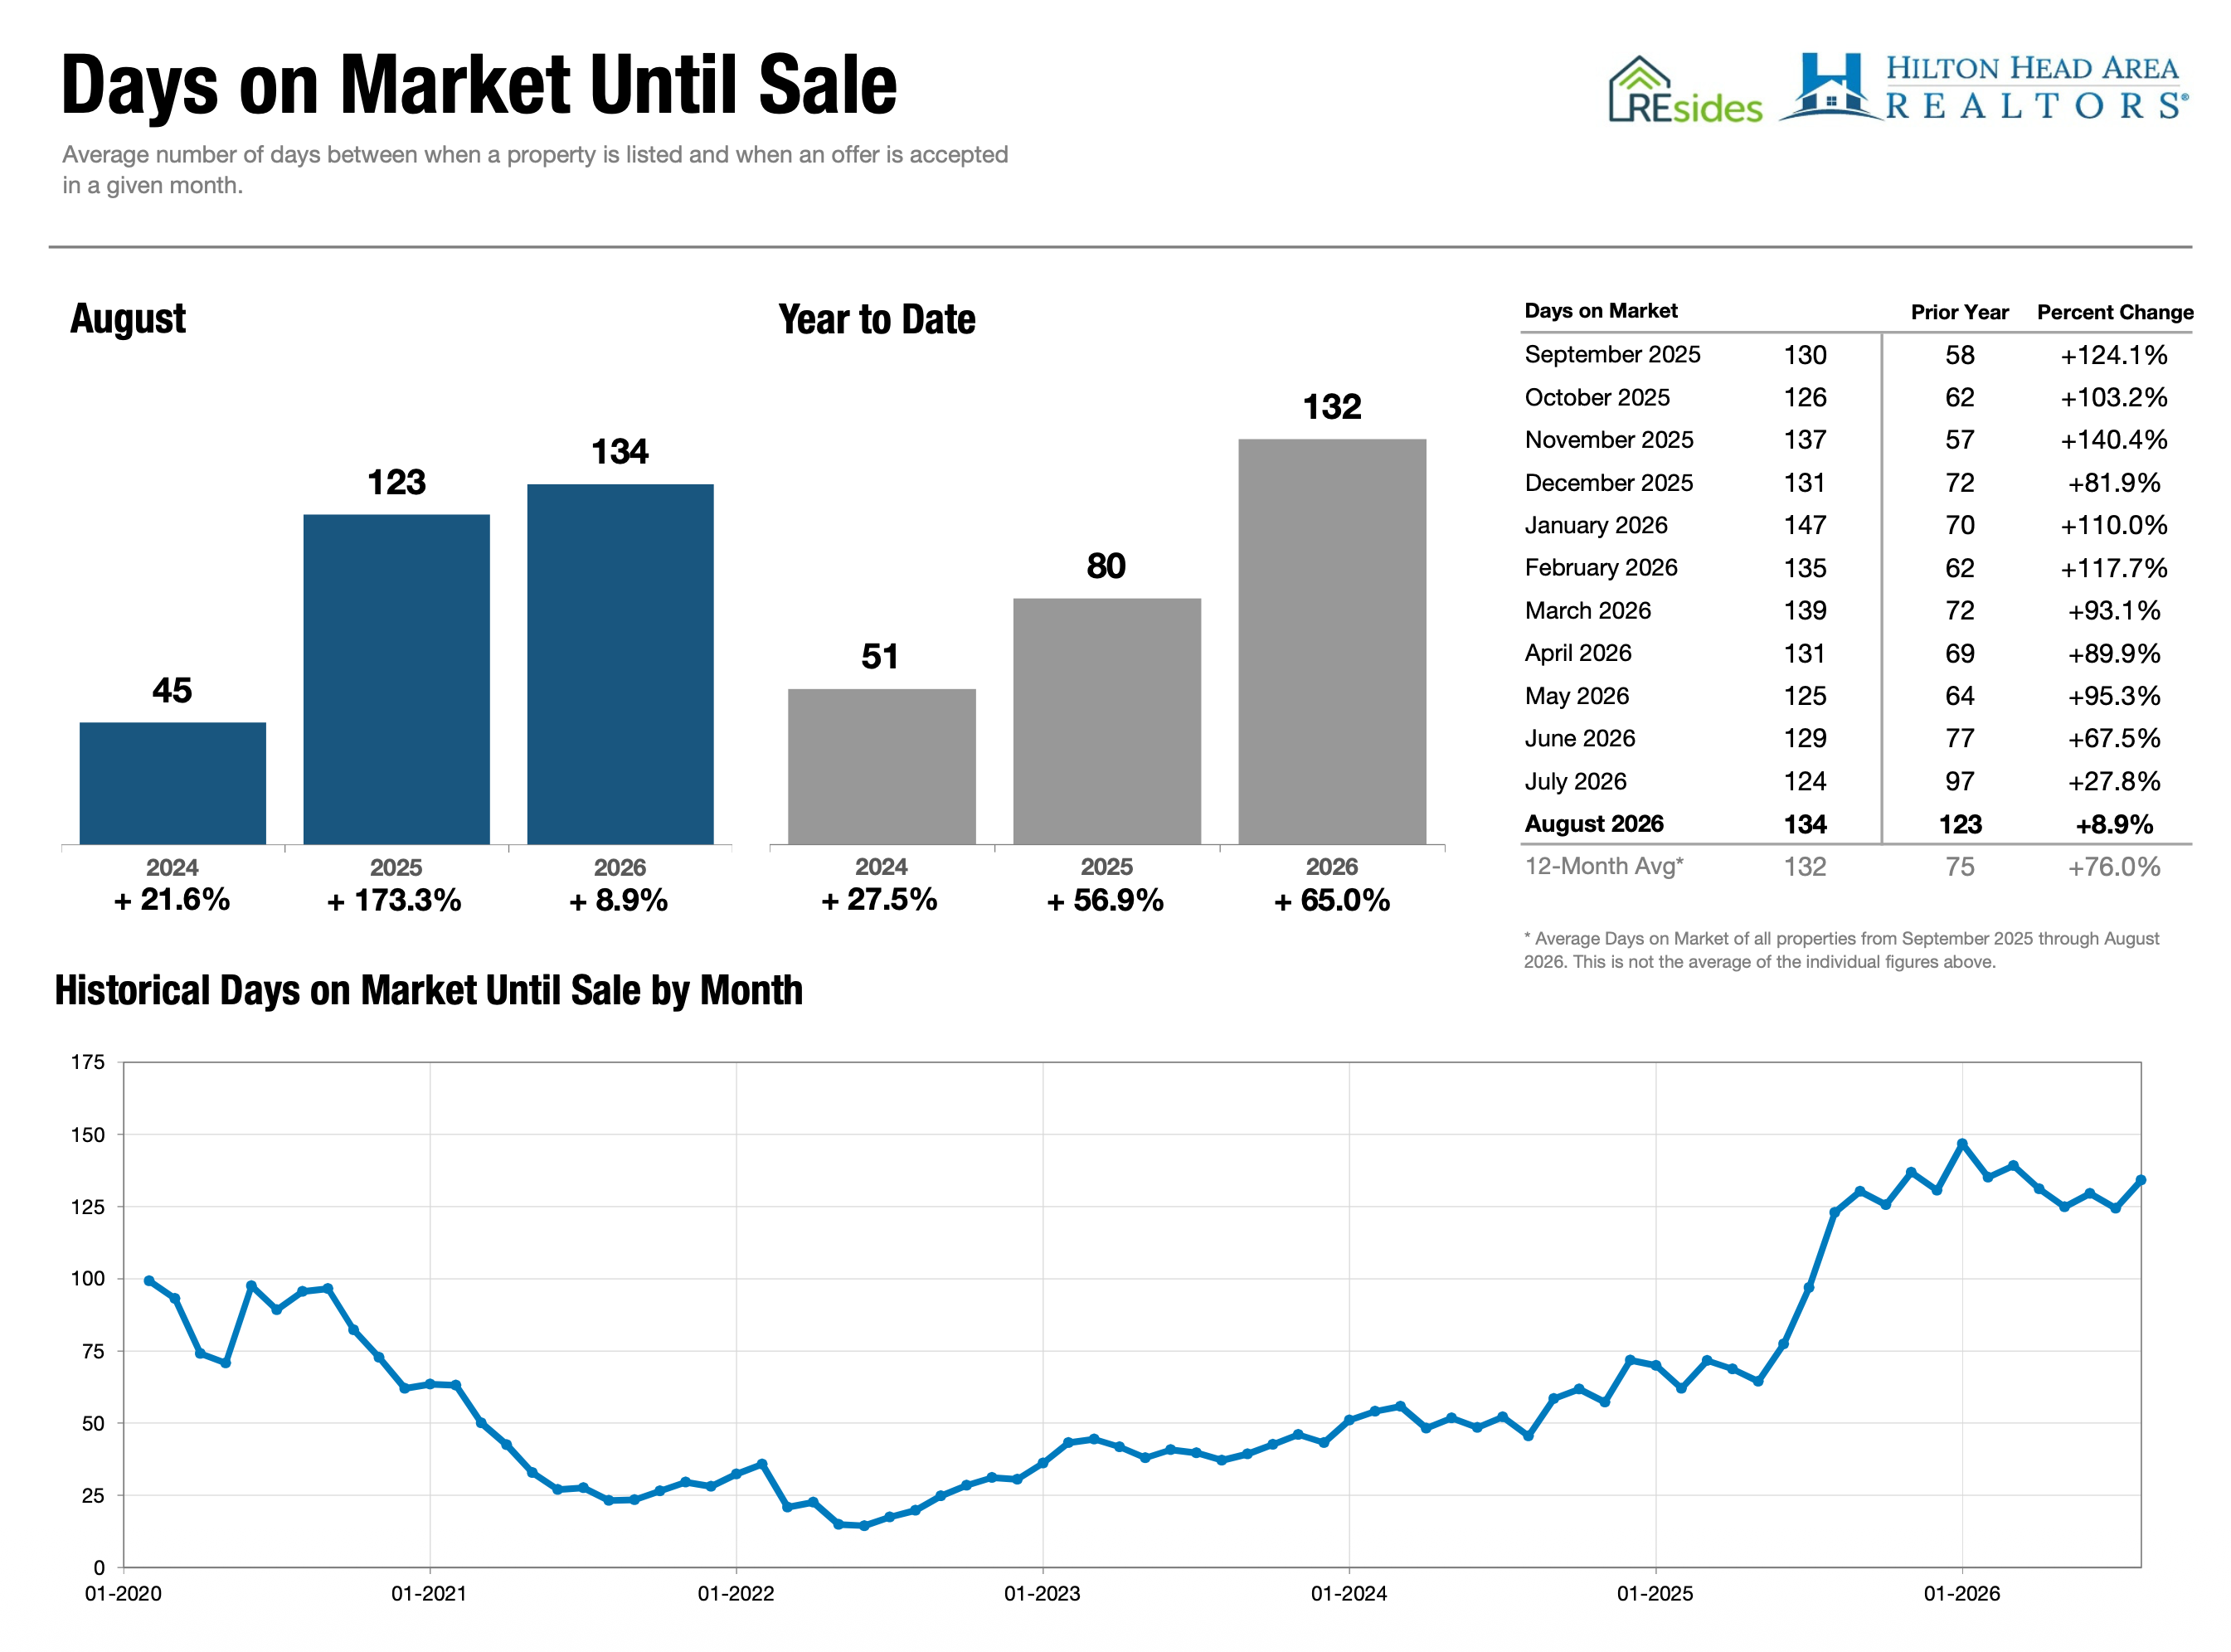
August homes averaged 134 days on market, compared with 123 days one year ago, an increase of 8.9%. More importantly, the 12 month average reached 132 days, compared with 75 days during the preceding 12 month period.
The pace of that increase has moderated considerably. Earlier in 2026, year over year comparisons regularly showed marketing times roughly doubling. By July, the year over year increase had narrowed to 27.8%, and in August it narrowed further to 8.9%.
That does not mean marketing time has returned to previous levels. It means the comparison is beginning to normalize as the market moves further from the unusually short marketing periods of prior years.
For buyers, the current environment can provide more time to evaluate a property and understand its relative value. For sellers, it reinforces the importance of entering the market with expectations that reflect today's pace rather than conditions from several years ago.
Days on Market Until Sale, REsides - Aug 2026
Pricing is Sending More Than One Signal
August pricing demonstrates why no single statistic should be used to characterize the market.
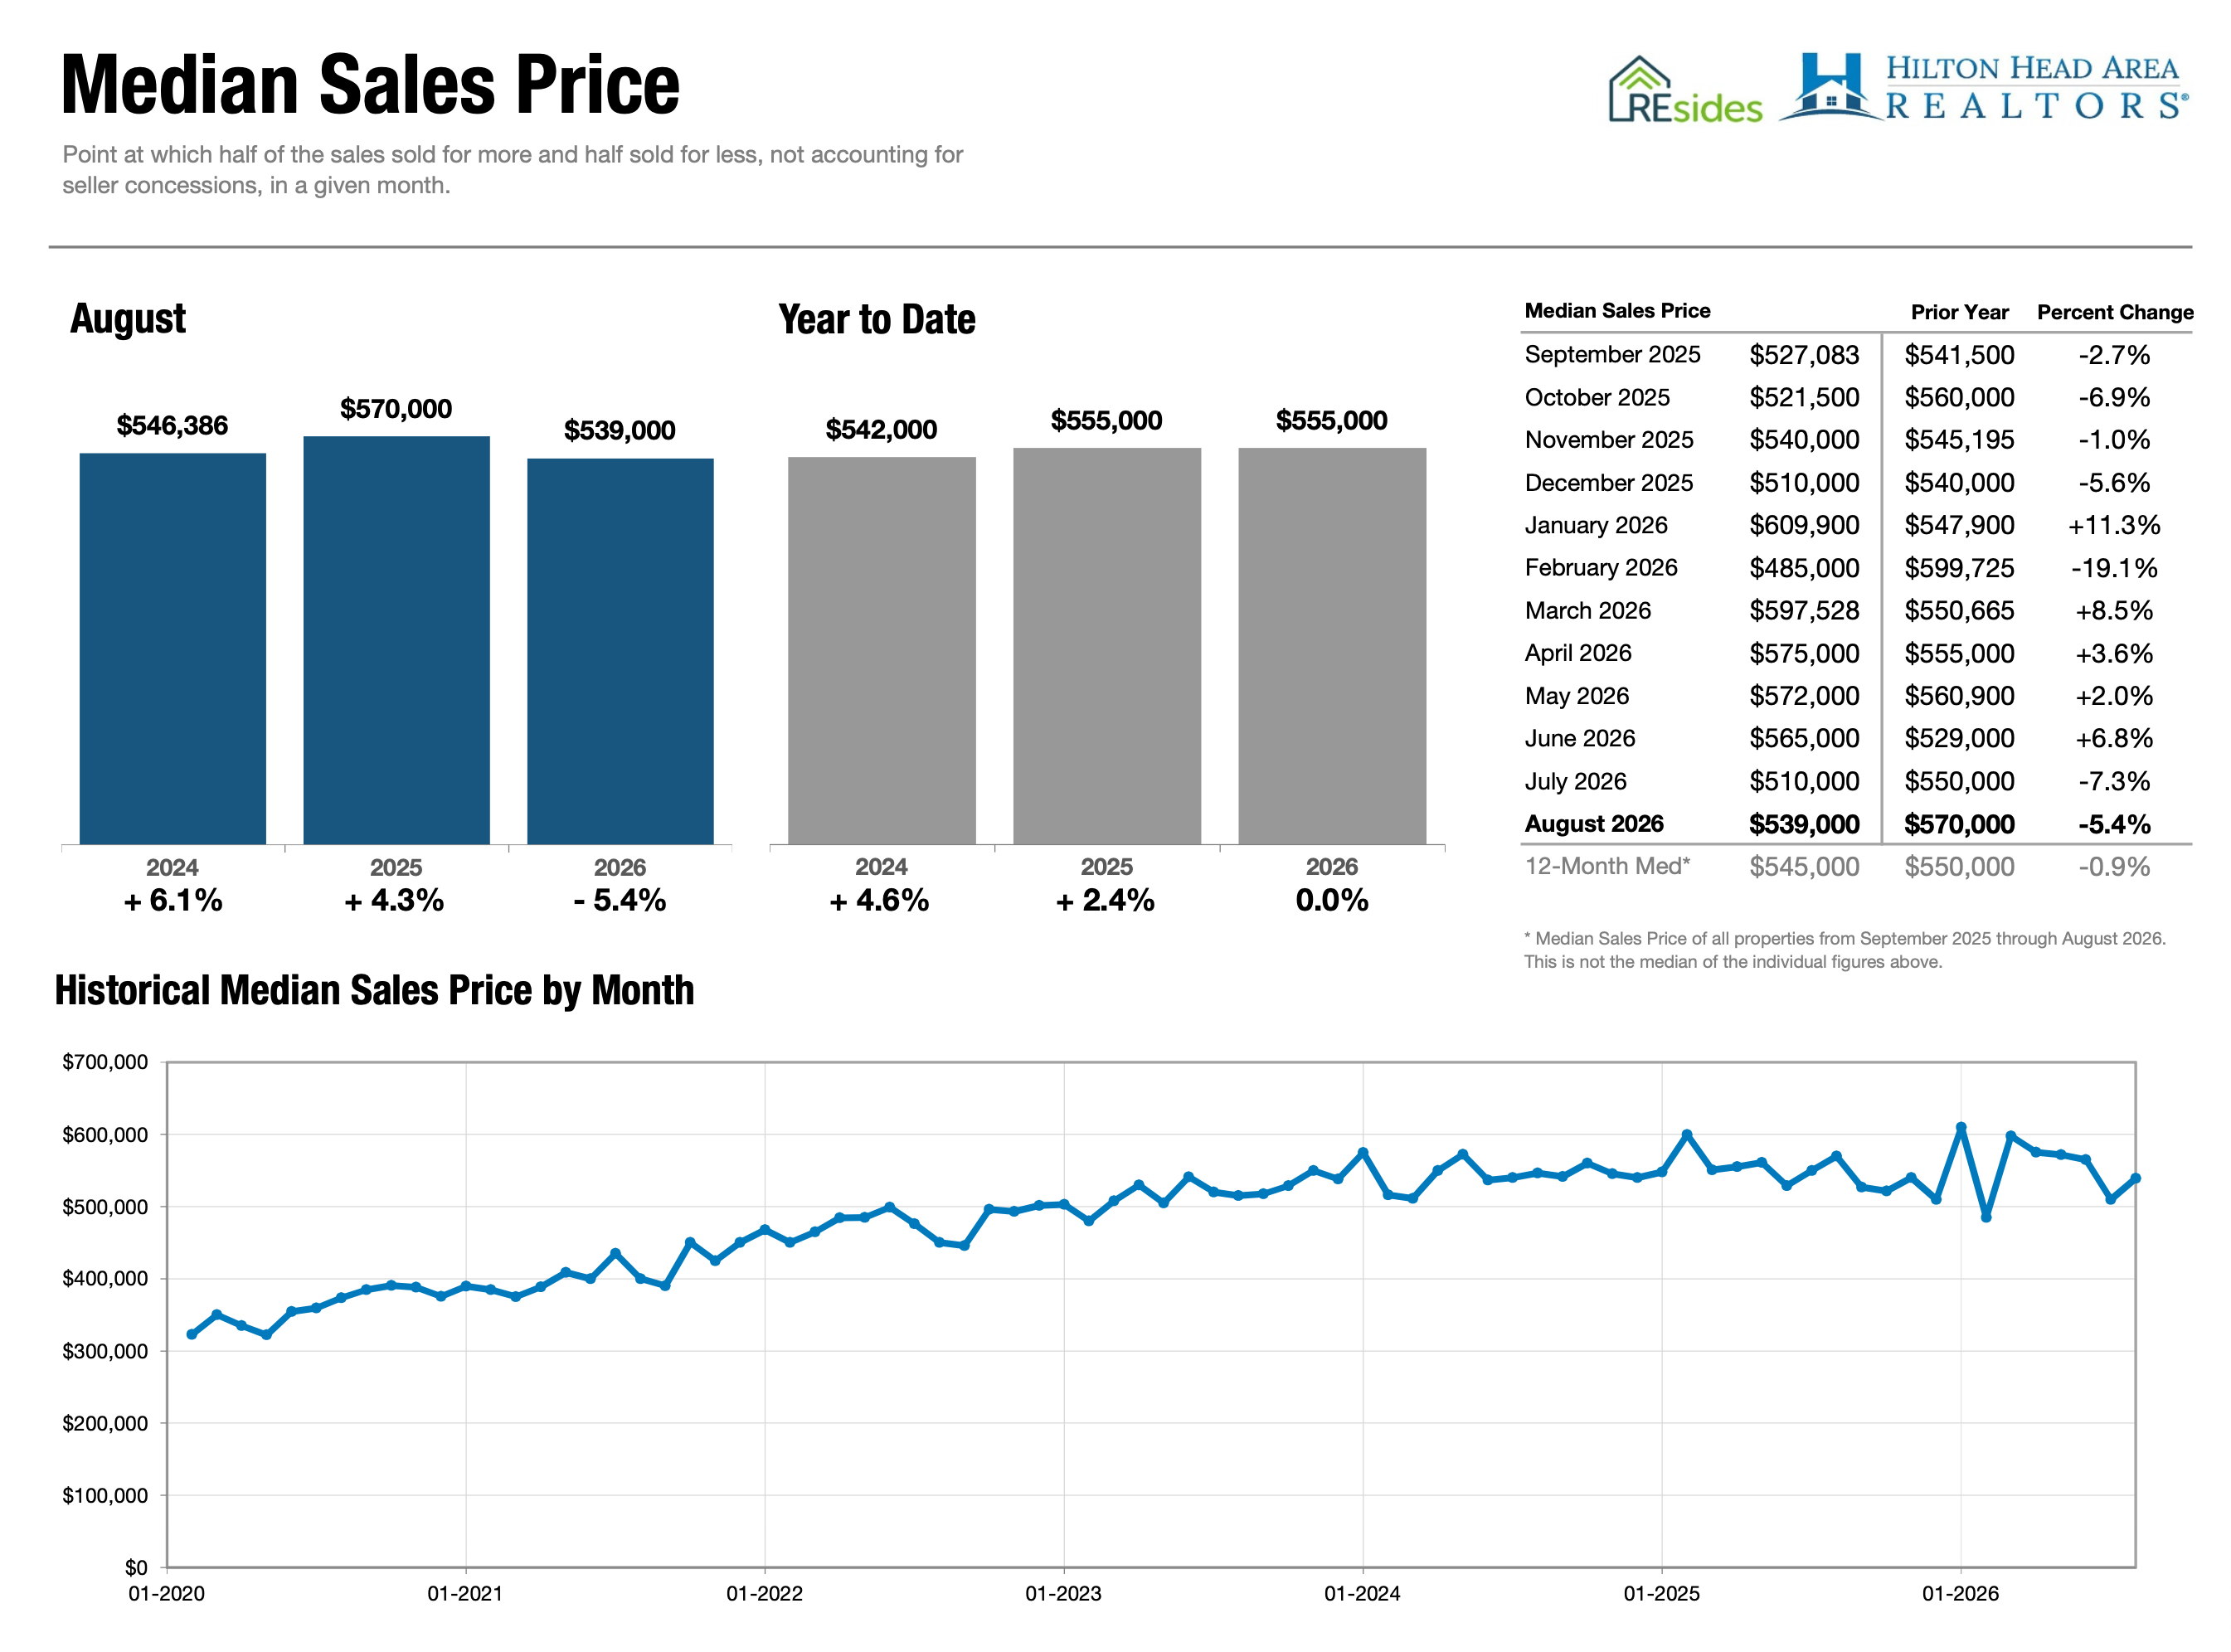
The median sales price declined 5.4% year over year to $539,000. The year to date median, however, remains unchanged from 2025 at $555,000. Meanwhile, the August average sales price rose 16.2% from $726,522 to $844,239, with the year to date average increasing 4.3% to $824,977.
Those figures are not contradictory. Median and average prices measure different aspects of the transactions that closed during the month. In a market containing everything from condos to multimillion dollar coastal properties, a relatively small change in the mix of sales can have a substantial effect on the average.
For that reason, the broader trend is more informative than interpreting August's increase in average price or decline in median price independently.
The rolling 12 month median provides useful context. It declined just 0.9% to $545,000, while the single family median increased 0.2% to $599,990.
Overall, the data suggests relatively stable longer term pricing beneath more noticeable monthly fluctuations.
Median Sales Price, REsides - Aug 2026
Higher Price Points Continue to Generate Demand
The upper portions of the Lowcountry market continue to be an important source of activity.
Over the 12 months ending in August, pending sales between $750,001 and $1 million increased 14.6%, the strongest gain among the report's price ranges. Pending sales above $1 million were also up 13.2%.
Closed sales show a similar pattern. Rolling 12 month closings increased 8.5% in the $750,001 to $1 million range and 8.4% above $1 million. At the same time, the $500,001 to $750,000 range recorded a 6.0% decline in closed sales.
The strength is therefore not uniform, even within the upper half of the market. But the continued growth above $750,000 helps explain why average sales price can remain elevated even while the overall median is comparatively stable.
It also reinforces a recurring characteristic of the Lowcountry: changes in transaction mix can meaningfully influence headline pricing statistics from one month to the next.
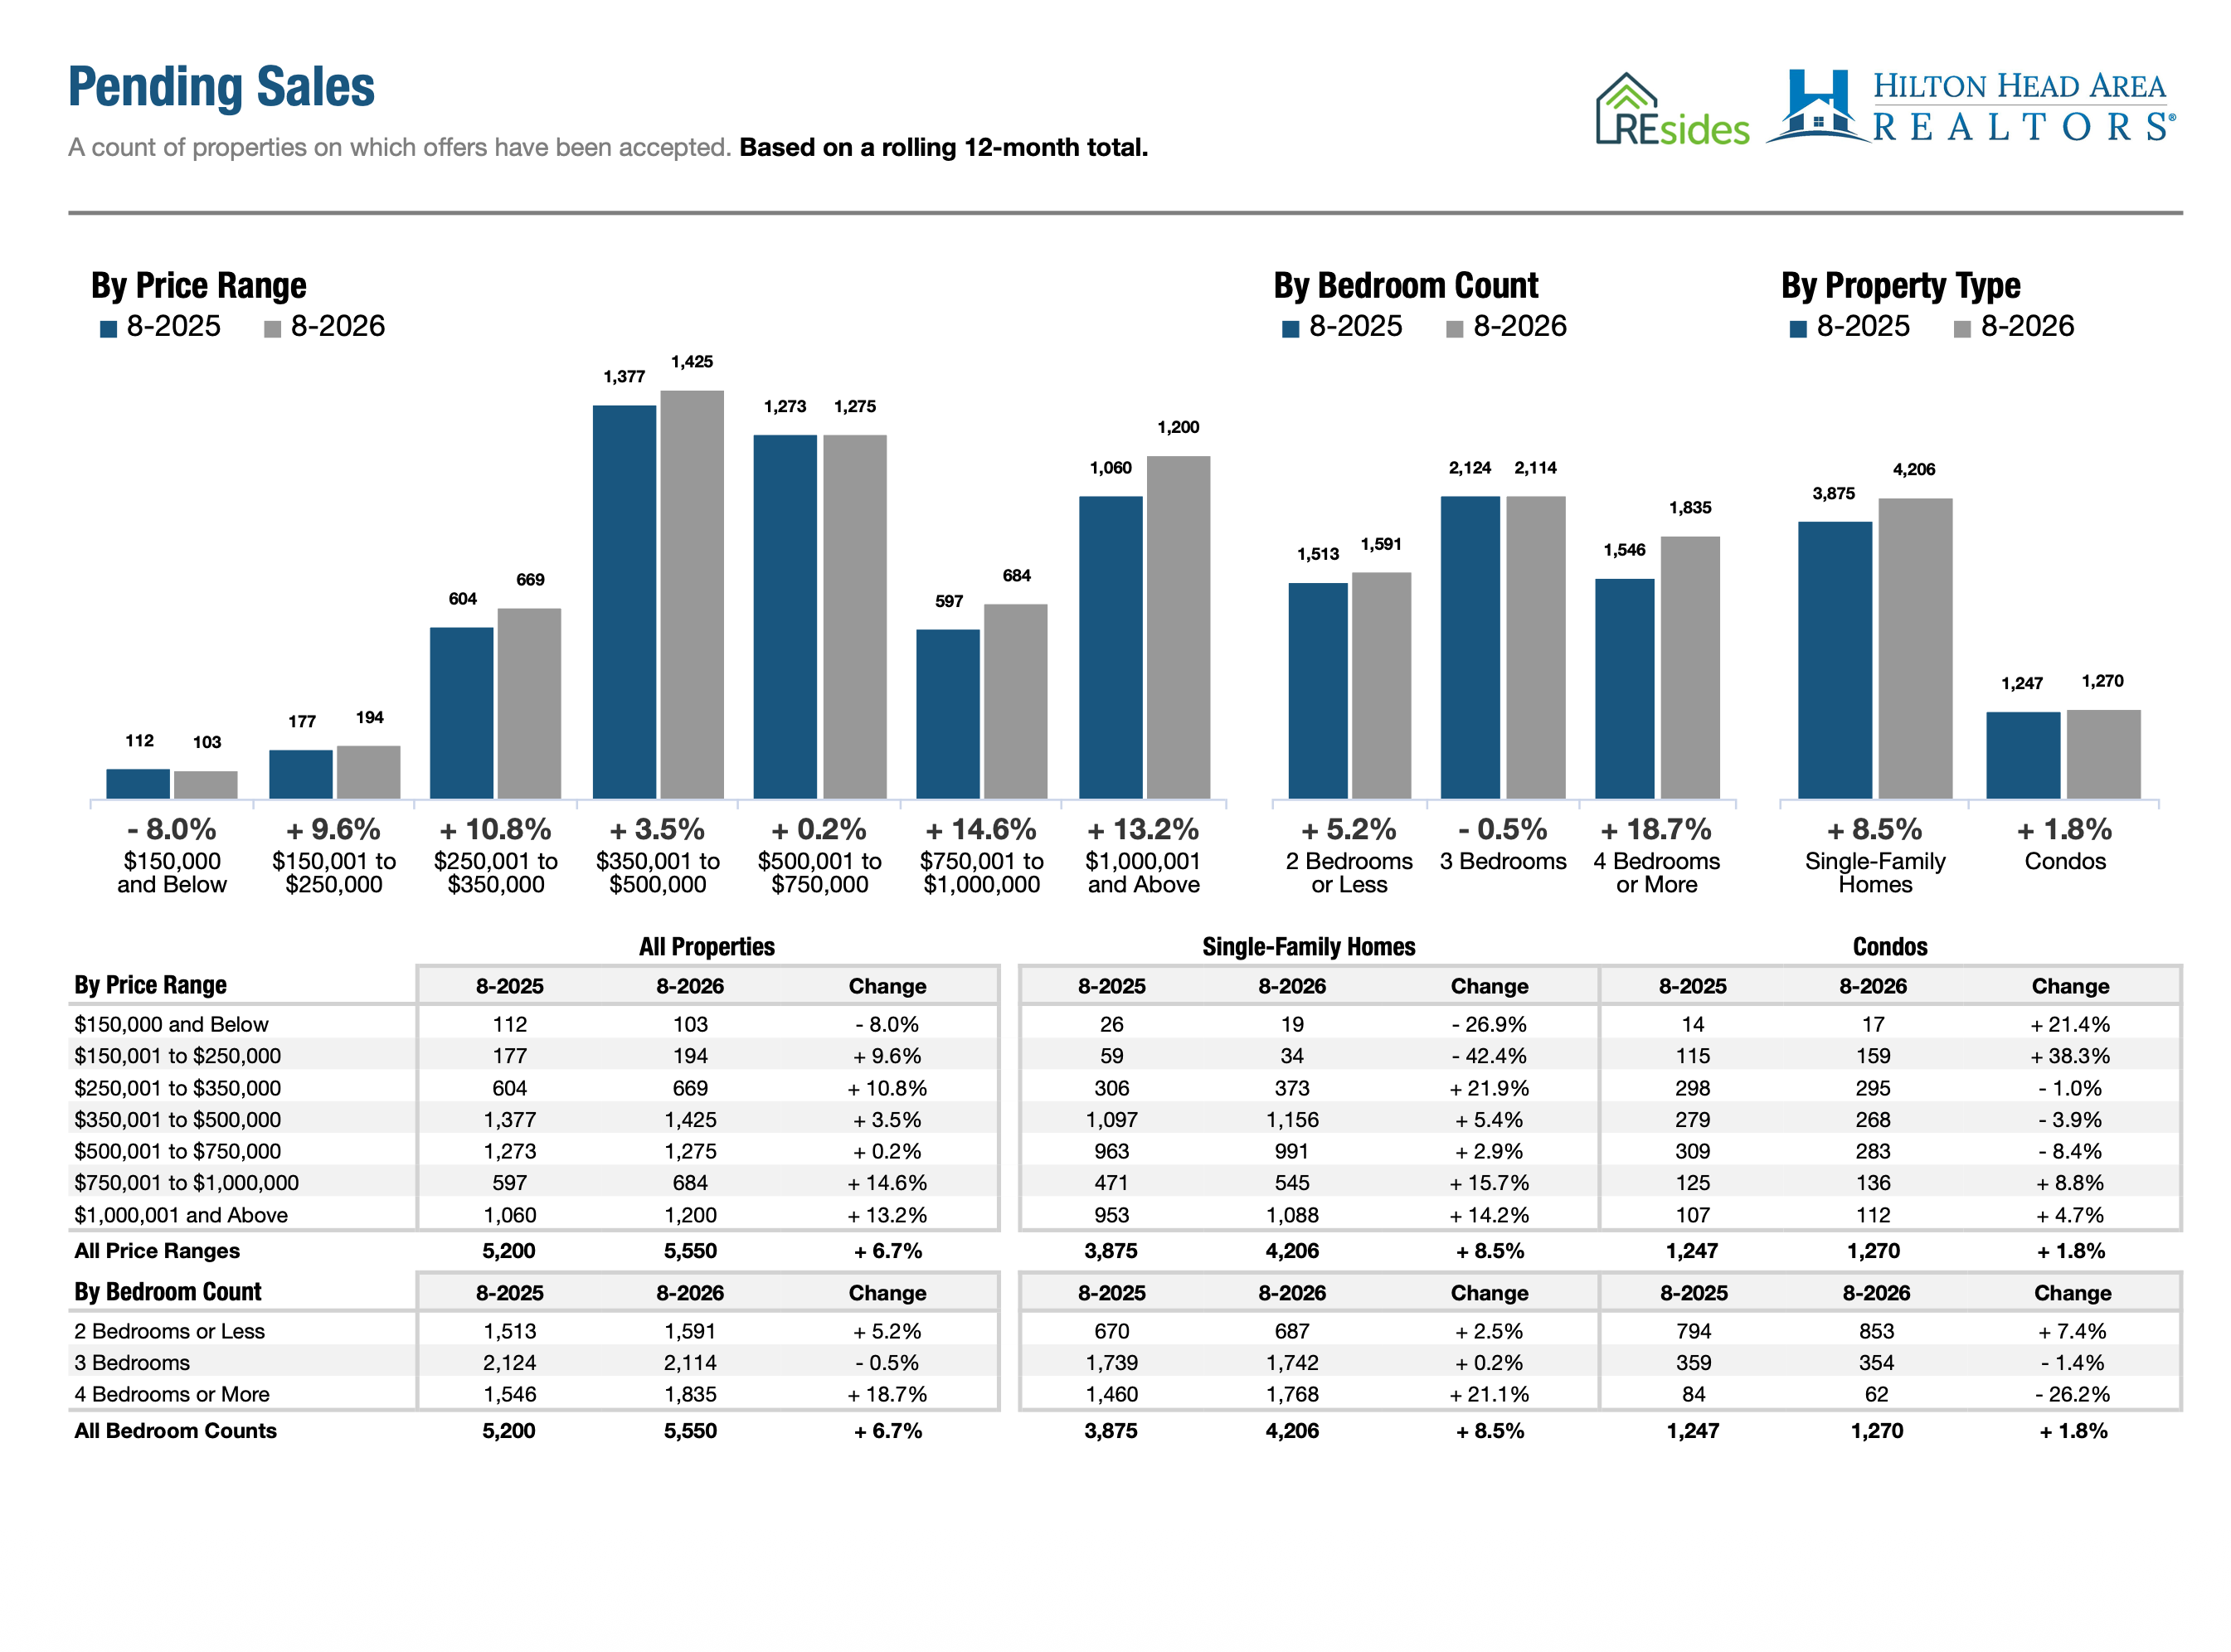
Pending Sales by Price Range, REsides - Aug 2026
Hilton Head Island, Bluffton, and Beaufort Continue to Behave Differently
The regional figures provide context, but conditions within the Lowcountry remain highly localized.
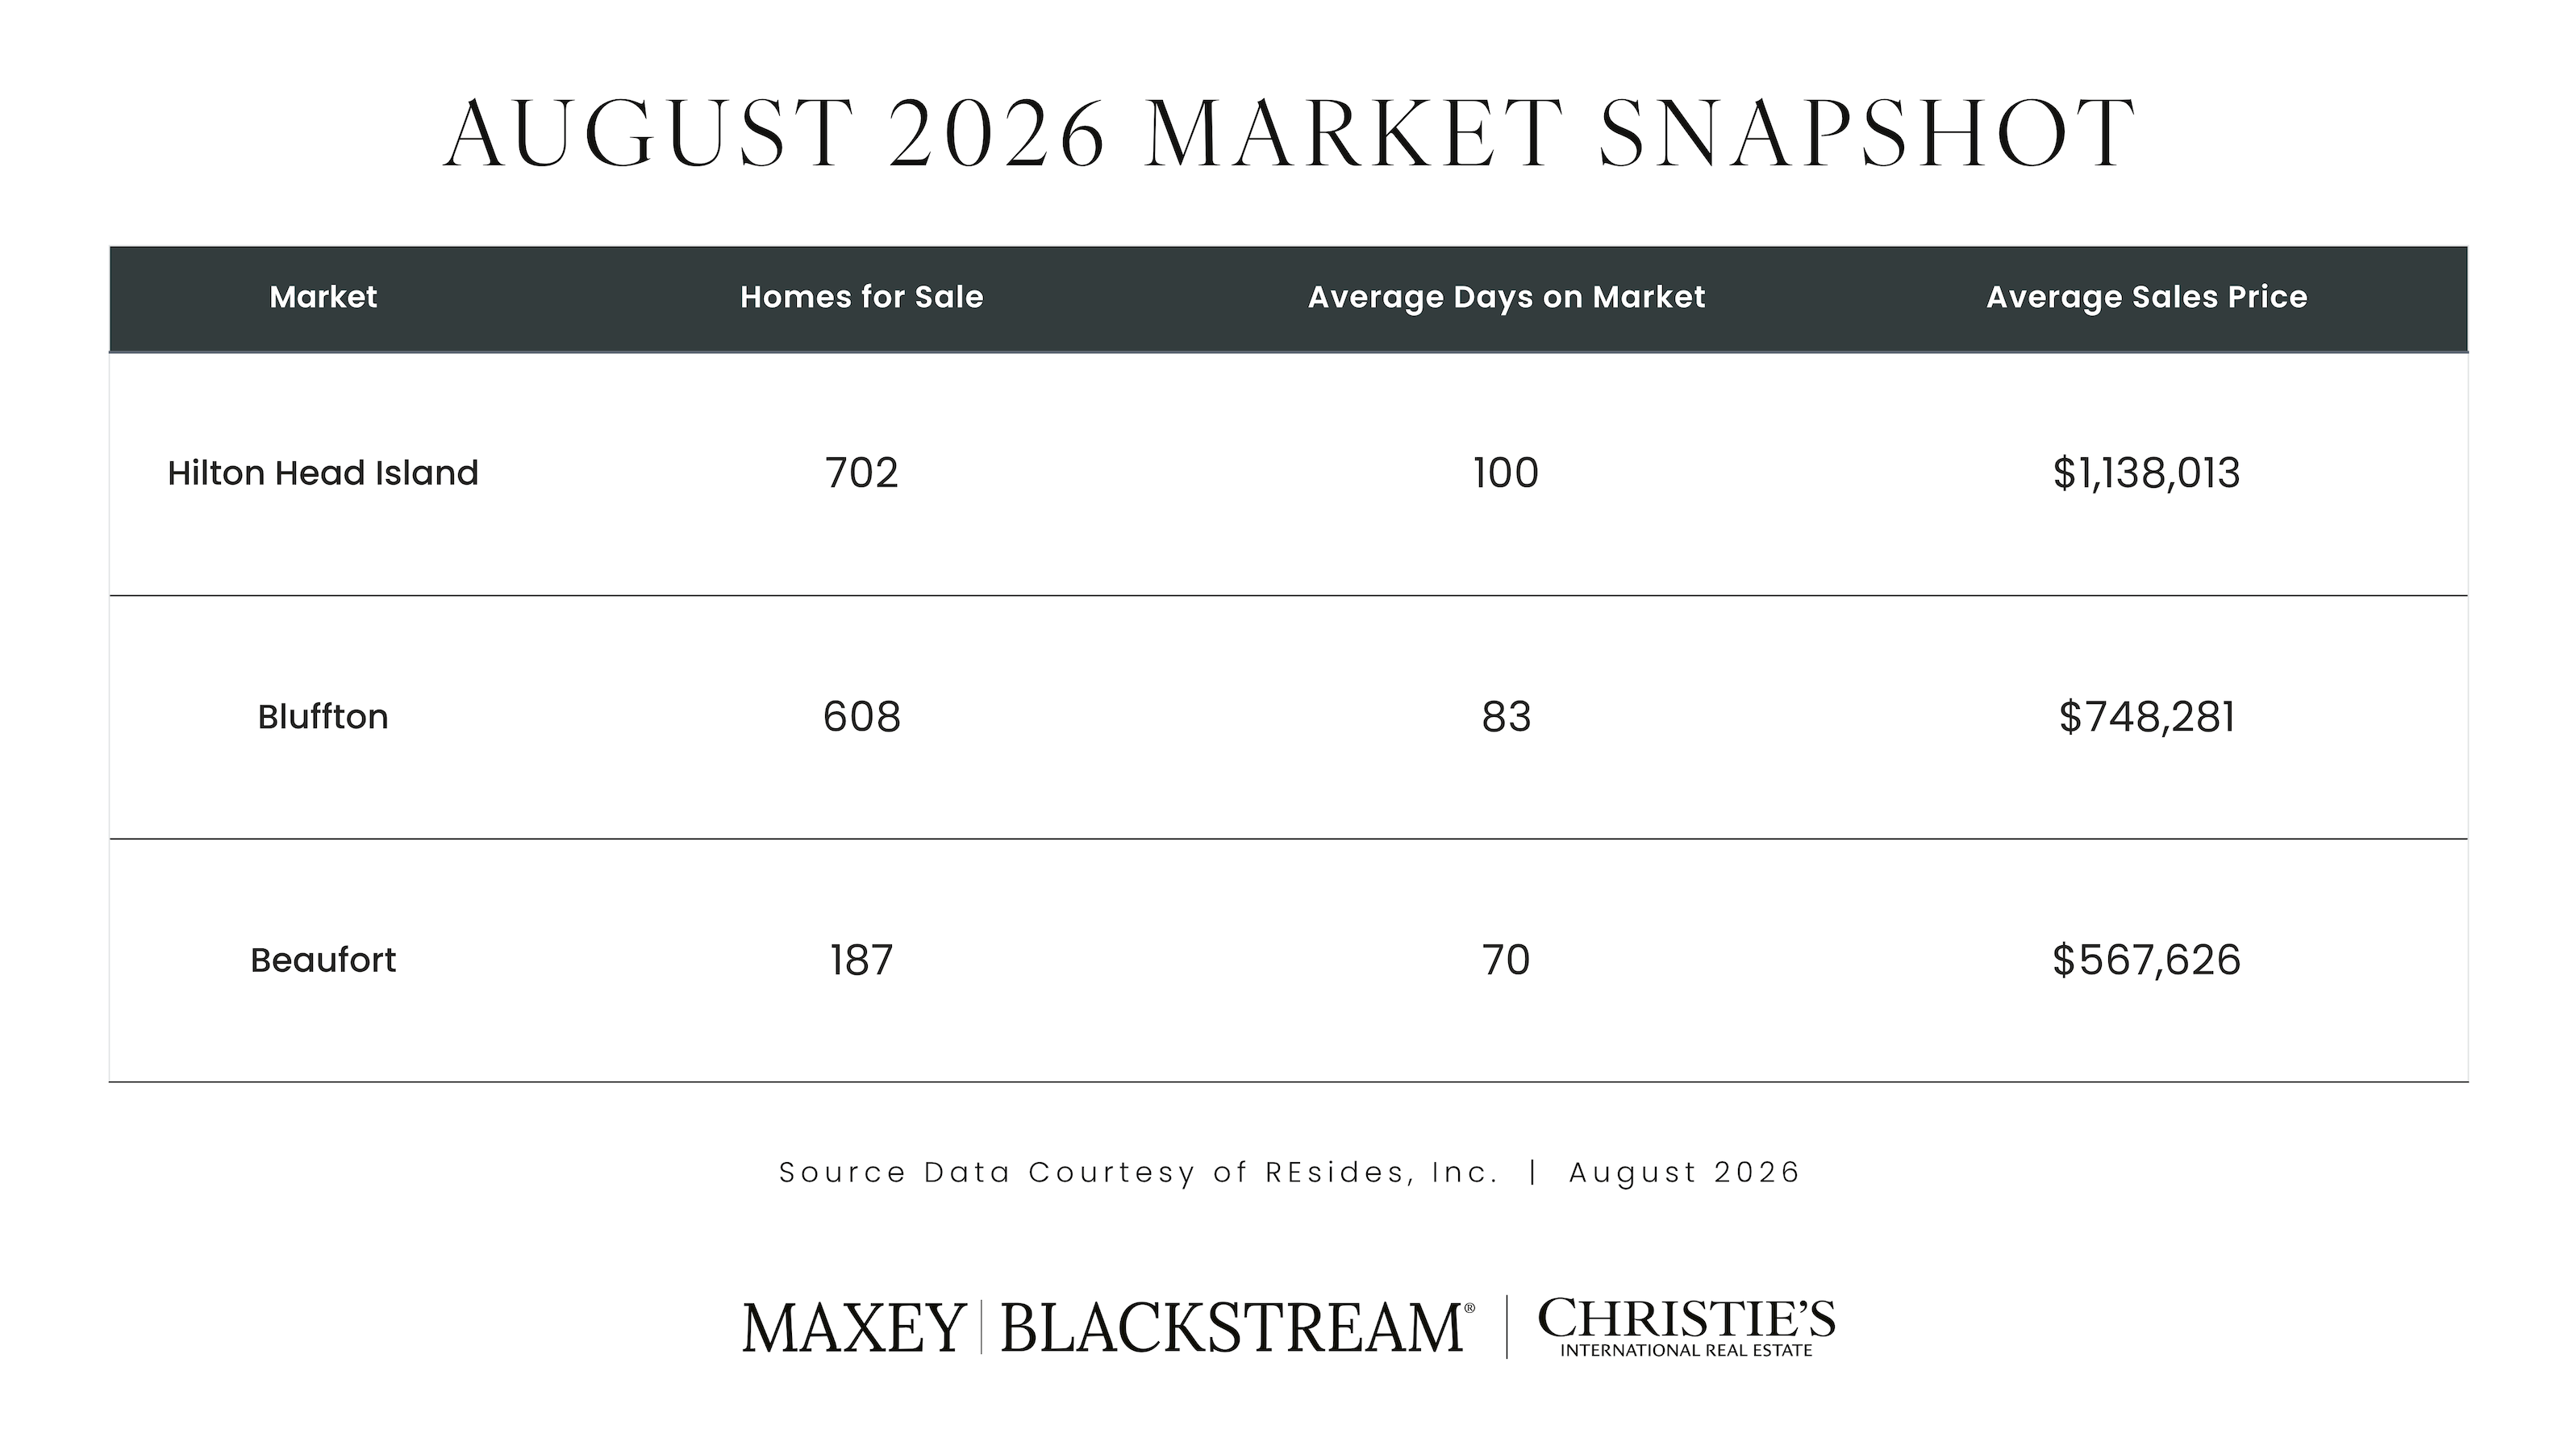
The separate market data you pulled for August shows 702 homes for sale on Hilton Head Island, 608 in Bluffton, and 187 in Beaufort. Average sales prices were $1,138,013 on Hilton Head Island, $748,281 in Bluffton, and $567,626 in Beaufort.
Marketing times also differed considerably. Hilton Head Island averaged 100 days on market, compared with 83 in Bluffton and 70 in Beaufort.
Those local figures reinforce why a regional average cannot fully describe the experience of an individual buyer or seller. Hilton Head Island's concentration of higher value and resort oriented properties creates a very different transaction environment from Bluffton or Beaufort, while each market carries its own inventory and demand dynamics.
For that reason, understanding the Lowcountry increasingly requires evaluating the market at both the regional and community level.
What This Means for Buyers and Sellers
For buyers, August presents a market with more time for consideration but not necessarily more supply. Inventory across the broader market is lower than it was a year ago, and pending activity indicates that other buyers remain active. Opportunities exist, but the amount of leverage available can vary substantially depending on location, property type, and price point.
For sellers, reduced inventory is constructive, but longer marketing periods make strategy increasingly important. Buyers have demonstrated that they are willing to act, particularly in several higher price ranges, but they also have more time to compare value. Pricing and presentation therefore remain central to attracting serious interest.
For both sides of a transaction, the broader numbers are most useful as context. The conditions surrounding a specific property may differ considerably from the regional headline.
Looking Ahead
August's data presents a Lowcountry market that is active, but deliberate.
Closed sales softened during the month, median pricing moved lower, and homes continue to require more time to sell than they did a year ago. Those are meaningful parts of the current market and should not be dismissed.
At the same time, inventory is lower, year to date closed sales remain essentially level with 2025, and both monthly and longer term pending activity have strengthened. Demand above $750,000 has also remained particularly resilient.
The question heading into fall is whether the increase in contracts translates into stronger closed sales and whether lower inventory begins to place greater competition around well positioned properties.
Those relationships will tell us considerably more about the direction of the Lowcountry market than any one month's movement in price or sales.
Data Sources & Methodology
Market statistics are drawn from August 2026 reports provided by REsides, Inc. and Hilton Head Area REALTORS®, with reports sponsored by South Carolina REALTORS®. The regional reports are current as of September 10, 2026.
Regional statistics reflect the broader Hilton Head Area REALTORS® market. Community level statistics for Hilton Head Island, Bluffton, and Beaufort are drawn from the separate August market data provided for this analysis. Market conditions can vary considerably by community, property type, and price point.
See More Articles